Trace the claim
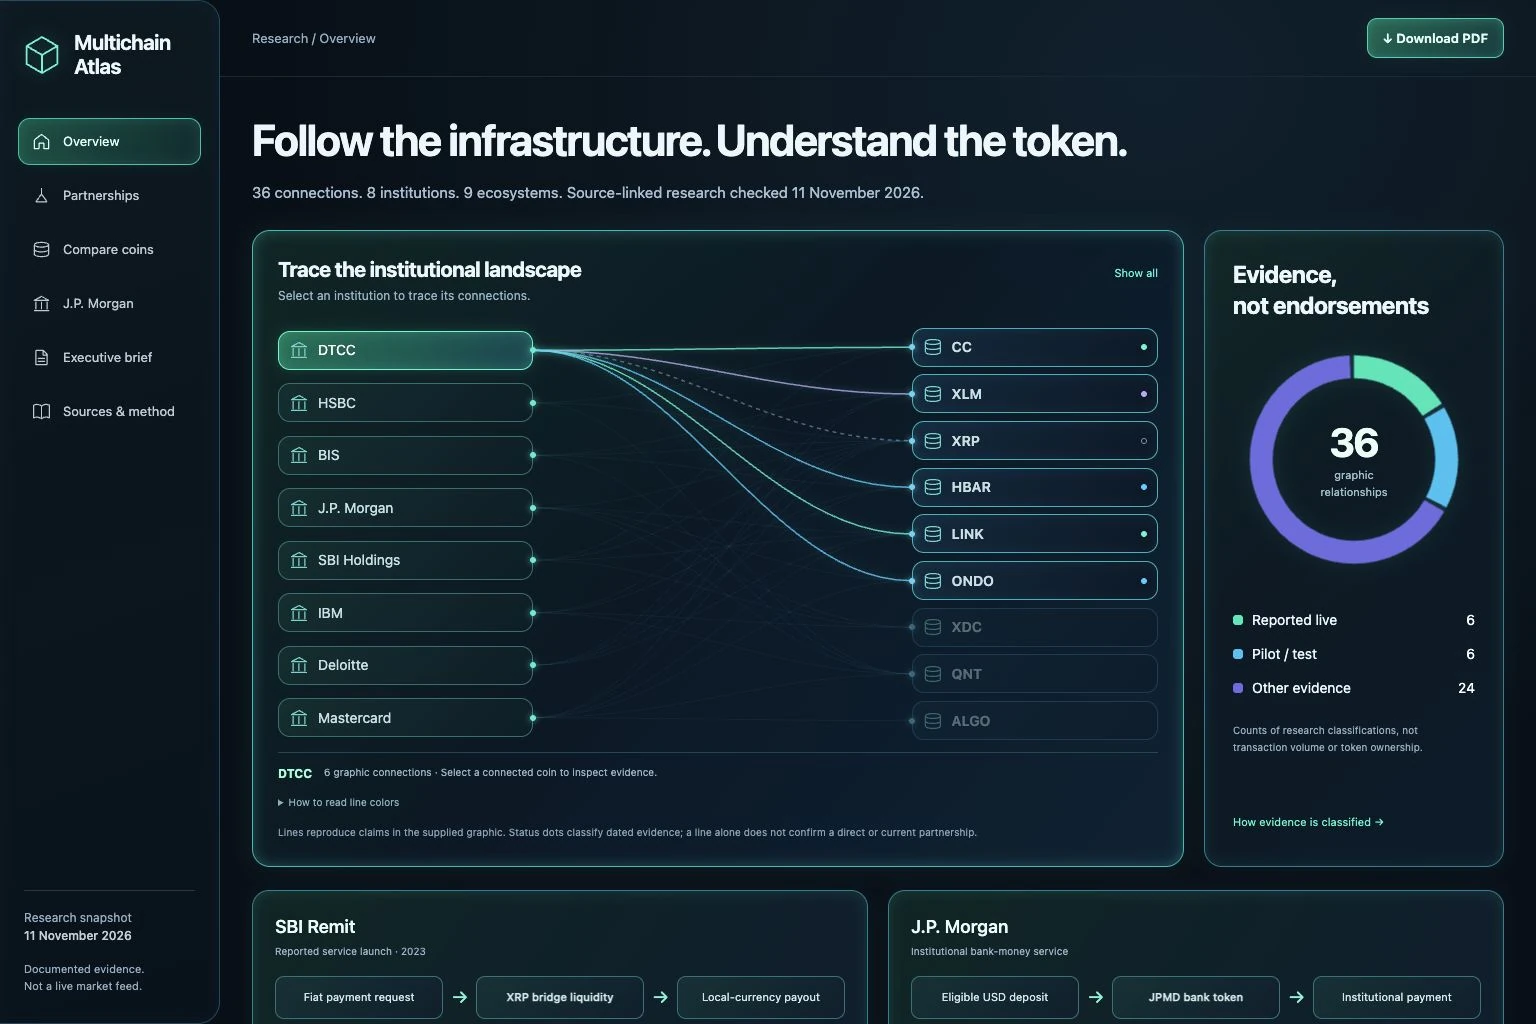
Transcribe the graphic’s connections. Follow company sources, subsidiaries, consortium links and dated announcements.
Multichain Atlas
An interactive research tool that helps readers distinguish production from pilots, trace the asset in a transaction, and separate token usage from a company’s need to buy it.
The problem
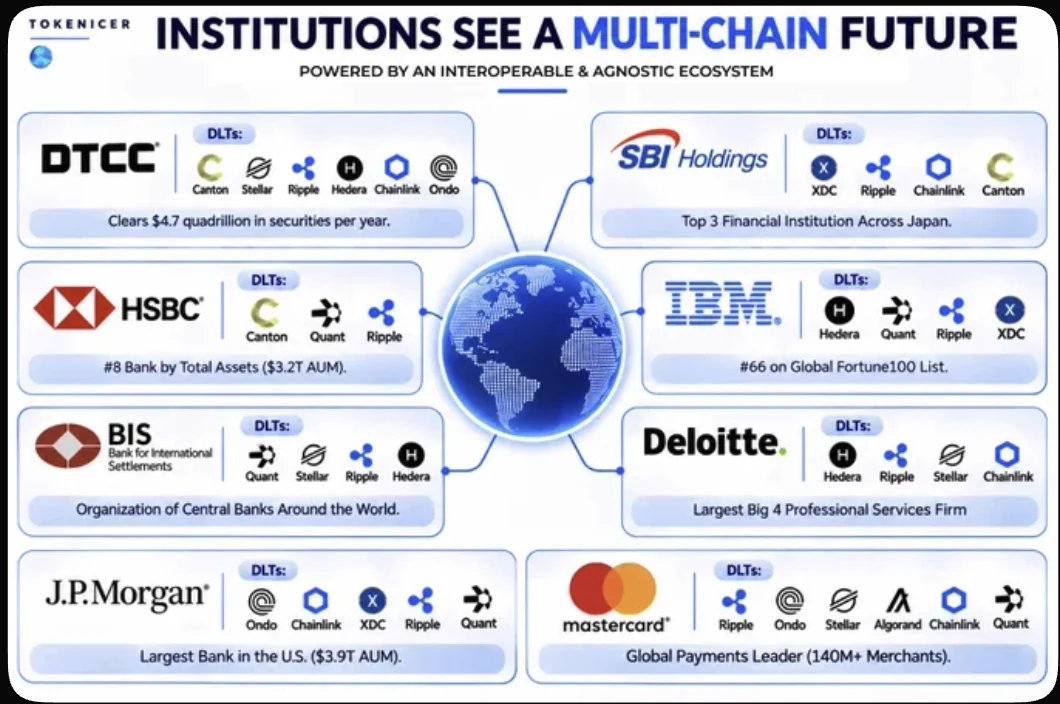
The starting graphic grouped major institutions with blockchain projects. It was visually persuasive, but the connections did not explain the relationship’s status, the asset involved, or whether a company had to purchase a public token.
The process
The research was organized around company announcements and protocol documentation, then translated into a consistent model: relationship, workflow, actual asset, token role, buying obligation and what remains unknown.
Transcribe the graphic’s connections. Follow company sources, subsidiaries, consortium links and dated announcements.
Distinguish a business relationship from a network deployment, and a fund or deposit token from a native coin.
Use a relationship map, explicit badges and one finding at a time. Keep the detailed explanation and sources available on demand.
Exercise filters, detail views and exports on desktop and mobile. Compare the PDF and website against the same badge definitions.
Human judgment guided the scope, hierarchy and iterations. AI assisted research synthesis, design exploration and implementation; the interface exposes the supporting sources and evidence limits.
The solution
The interface gives readers a repeatable way to interpret each relationship, instead of treating every logo as the same kind of adoption.
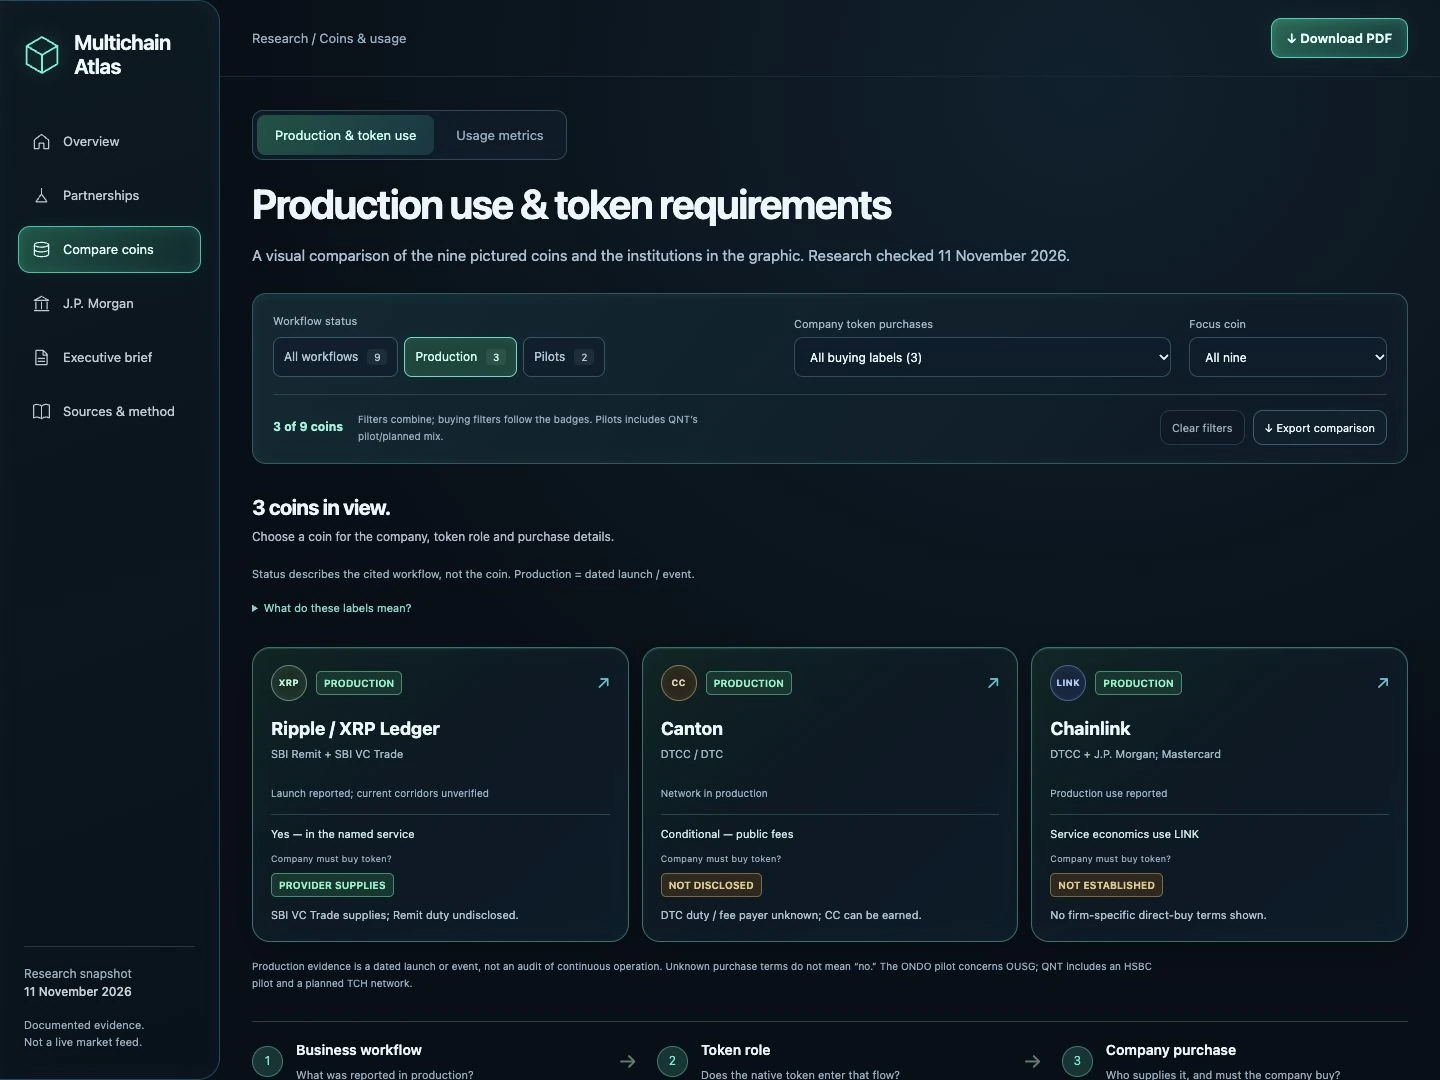
Workflow badges separate dated production events, pilots, planned connections, exchange access, node hosting and ended programs.
Native coins, bank deposits and fund shares have different roles. A pilot using OUSG is kept distinct from ONDO governance-token use.
Provider-supplied liquidity, undisclosed purchase terms and no requirement shown stay separate. Unknown is never presented as a definitive “no.”
Quick filters narrow the cards, detailed table and CSV together. A production filter describes dated workflow evidence, not independently verified continuous operation. Pilots can involve a different asset from the pictured native token.
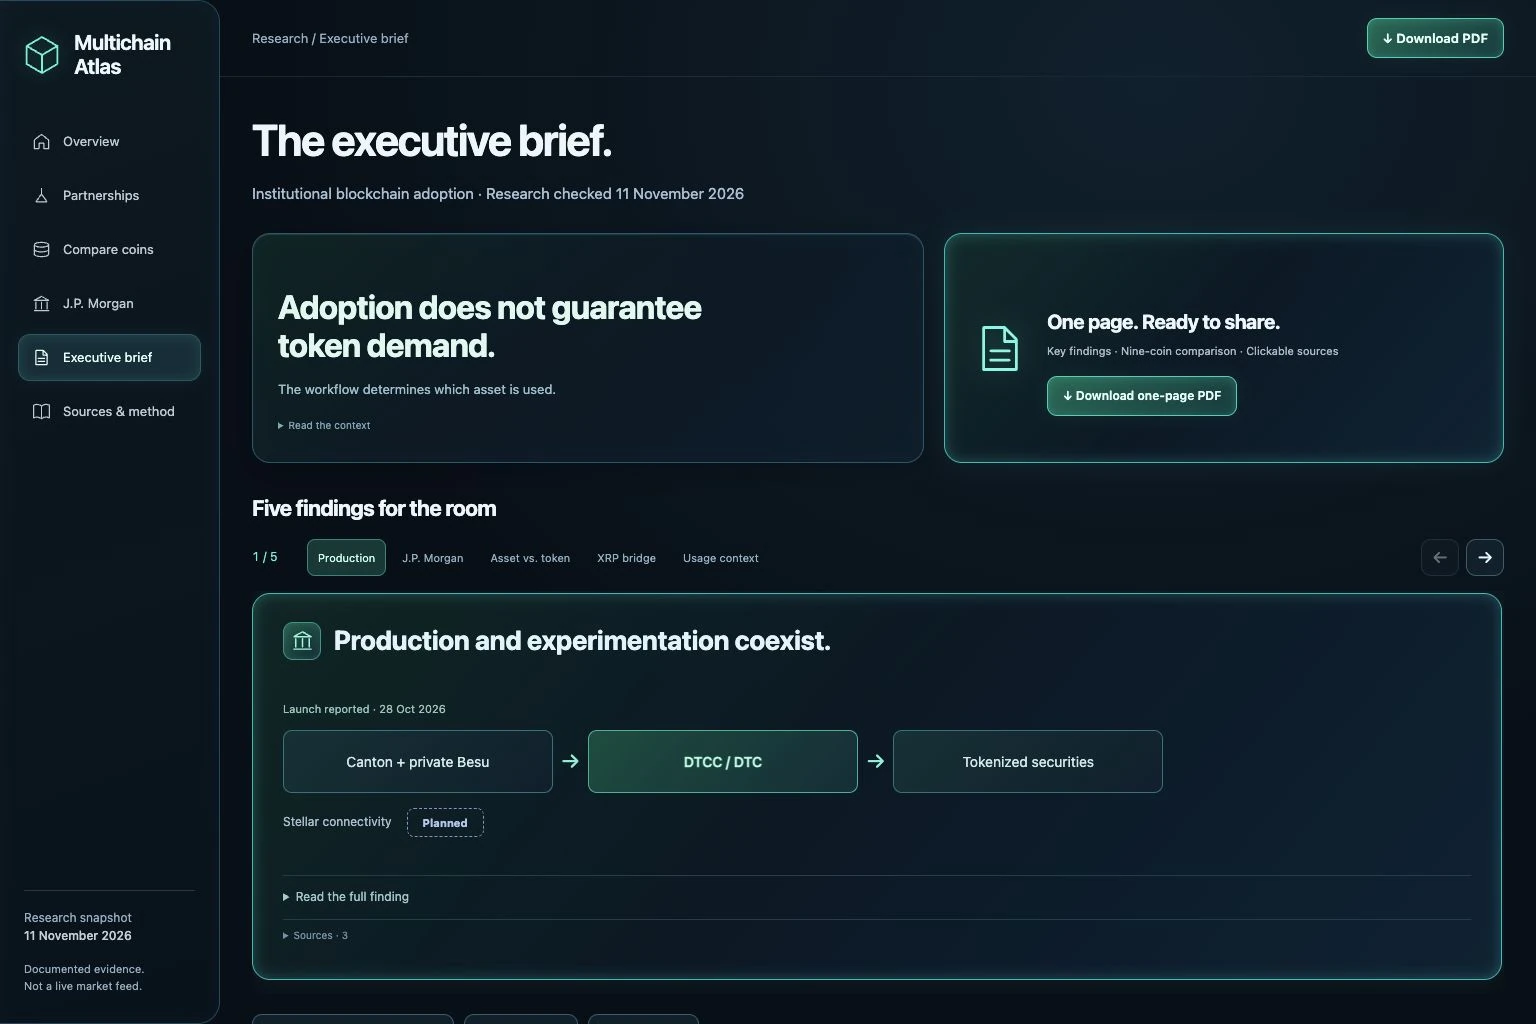
The executive brief uses scrollable chapters and topic controls. The takeaway and asset-flow diagram lead; the complete explanation and smaller source links expand when needed.
The outcome
The delivered artifact connects exploration, evidence inspection and shareout in one experience. Its scope is explicit:
Task-based reader testing could assess whether people can distinguish a production event, identify the actual asset, and locate a purchase obligation. Comprehension and usability outcomes have not been measured.
Independent design and research project, not work commissioned by or endorsed by the institutions pictured. Research is a fixed 11 November 2026 snapshot; dated announcements are not an operational audit or a token-return forecast.
Explore a company, compare a coin, or take the brief into your next discussion.